FairView

WEBSITE/PLATFORM TOOL
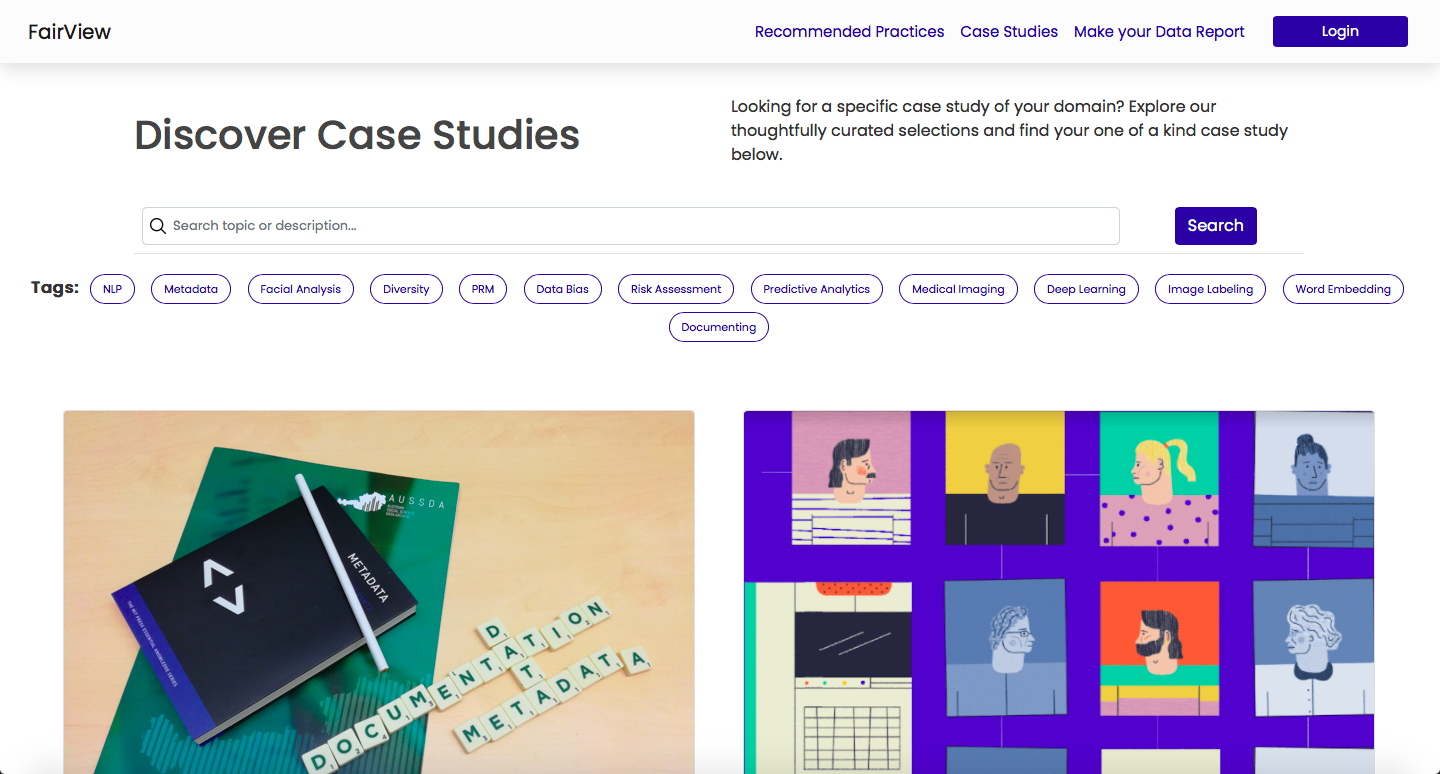
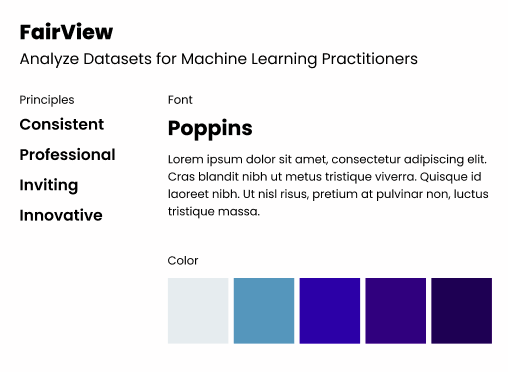
FairView is a project run by a group of enthusiastic college students offering a tool to help ML Practitioners and Data Researchers to gain deeper insights into their demographic metadata and realize possible bias/unfairness. https://fair-view.herokuapp.com

Context

 01
For this project, I worked as a Project Manager Intern for a 7-week internship/hackathon program hosted by InternHacks. I led a team of 2 engineers and 1 designer to research about the problem area, conduct user interviews, ideate, technically build up our final product, and at the end, we won the Best Technical Project Award.

Date

Jun 2021 - July 2021

Role

Project Manager

Need

Creating a tool that allows ML practitioners to see the distribution of demographic metadata.

Immersion

Research

02
AI is being deployed so rapidly, and in ways that can have serious impacts. Bias has been identified in facial recognition systems, hiring programs, etc. We defined the problem area we want to focus on: One of the challenges for ML practitioners lie in realizing the underlying bias of the datasets used for training the algorithms. In particular, the collected data might not represent the diversity of the user base, leading to the product excluding or performing not as well with certain subpopulations.
Our Hypothesis is: A tool that shows the distribution of the demographic metadata will help ML practitioners realize any unequal representation (in gender, income, etc) and augment to equalize their training data accordingly. We interviewed and surveyed professionals and students in this field to validate that assumption. We received feedback that - no, students are not aware of how to mitigate fairness from college classes and yes, professionals often become aware of this risk only after using their algorithms in the field.

“As an ML practitioner, most of the time we capture the overall accuracy, but wouldn't get the whole representation of the real world without thorough area analysis on different groups.” 

Conceptualization

Visual System

03.a
Result
Wireframes & Lo-fi prototypes
In our first step to build our project, we created a style guide, emphasizing the need for our design to be consistent, professional, inviting and innovative. We started to create some low-fidelity wireframes and prototypes to plan out the pages we wanted to incorporate with the use of FIGMA. As the wireframes got more detailed, we created various user flows to help the engineers envision how once could navigate through our website.
Technology


Stack
03.b
Utilizing a client-server architecture, we built our web server in Python due to its’ data analysis capabilities, using Flask, a web dev Python framework, on top. For version control, we used Github, and utilized continuous deployment to Heroku, a cloud platform to host our server.

We built functionality to upload files, analyze the metadata, and return a report in an organized table. First, the user uploads a csv file on our website, and submits the file to our web server via POST request. Our python script reads the file and looks for relevant attributes from the metadata. We compile these attributes, count the frequencies, determine the most and least common values, and return that data to the users via HTTP response in an easy-to-understand format.


CLIENT SERVER ARCHITECTURE

Implementation

Prototyping

04.a
Mindful design empowers users to be the innovators; using our products simply as the tools to help them reach their goals. Designing in moments rather than flows help keep the interface open and flexible to encourage
this type of relationship. These are the moments we feel would be important based on our research.
Selection of Interfaces
Home Page & Main Pages Flows

Review

Introspection

05
One of the main challenges we faced as a team was when one of our engineers had to leave the program due to personal reasons. From that point forward we realized just how important efficient communication is in a team to achieve this effective collaboration that we had always strived for. Being able to support, help, and encourage each other with consistent team meetings and daily updates was of the utmost importance and priority for the rest of the hardworking weeks that strengthened our team connection and made us even more proud of the outcome that we made together.
For our metadata report since we are using Flask Python. Based on user testings with ML professionals, In the future, we plan on adding more statistics for the integers (numeric features) like mean, median, standard deviation, etc using pandas library for reading in CSV files. Our hope is that this makes the data reports easier to view and understand using histograms for visualizations with matplotlib.pyplot.
THANKS TO INTERNHACKS FOR THIS OPPORTUNITY

Next

WEB-APP DATA VISUALIZATION - UX/UI DESIGN

DawgPath

A tool that students can use to set expectations before the first day, provide context to their interactions with classmates, and support a basis from which to begin building relationships within the classroom, both virtually and in-person.
Get to know more